Can't find your features in the field? That's not a problem. Just use your previously recorded coordinates as a way point to retrace your steps.
Use geotagged photos in the office to help others visualize their environment or in the field to help new field staff to find what they are looking for.

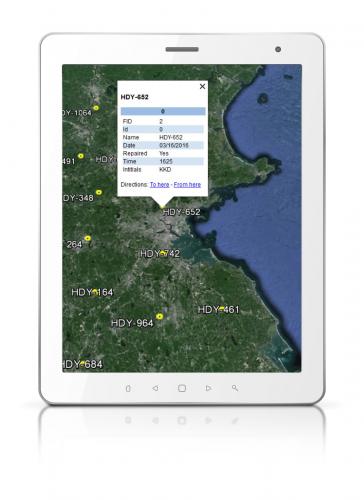
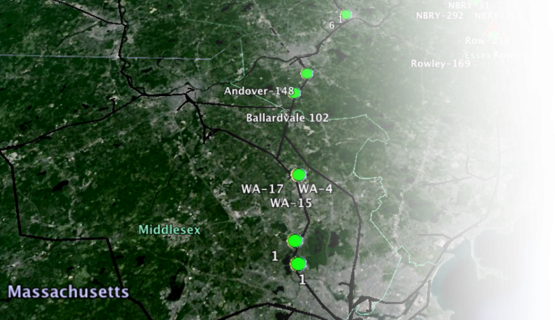
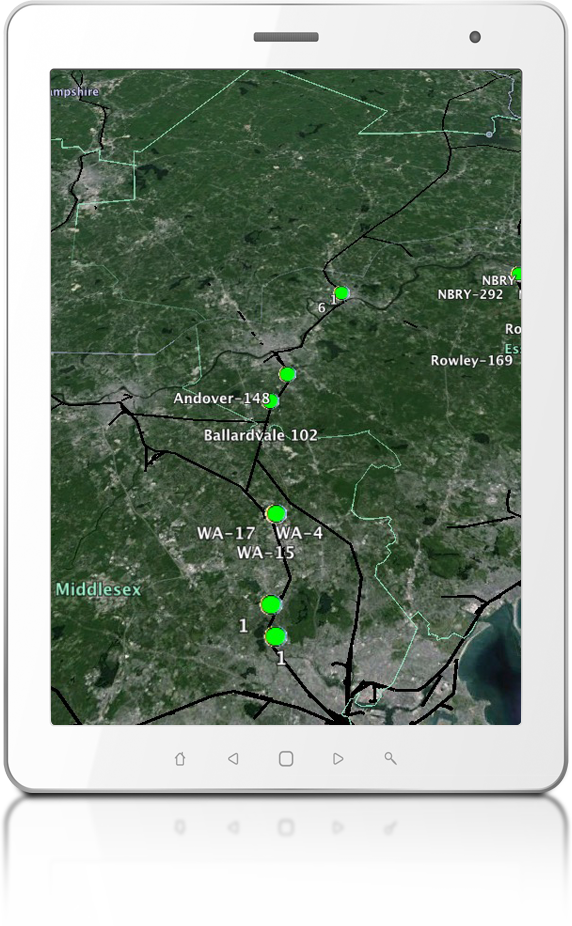
Explore your data spatially in the field or office. Quickly visualize your data and their attributes spatially via Google Earth or your own GIS mapping software.
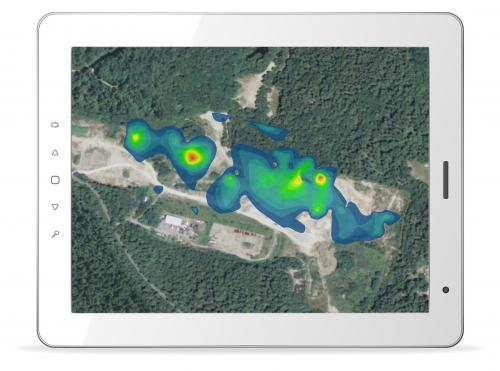
DataSolv can generate groundwater flow maps based off of your groundwater elevations as collected in the field. Sampling for contamination? We can use your lab data to generate plume maps so you better understand what's happening under the surface.
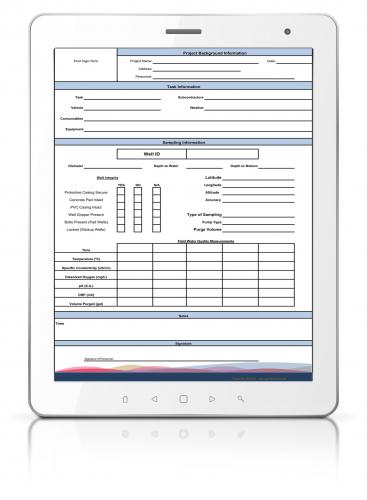
DataSolv’s web-based database back end receives field data collected and merges the data into a variety of outputs, including Excel tables, PDF field reports, photo logs, and raw .csv files that can be imported in your own databases. Automatic delivery of tables, field reports, logs and .csv files come via email immediately upon data transmittal from the field tablet. DataSolv has the ability to transmit data via email to recipients based on customer project location, client, or even based on field user.
DataSolv’s database integrates seamlessly with ESRI’s ArcGIS. With the ability of the field app to geo-reference field data through GPS logging, we can provide GIS imagery to allow our customers and their clients to better see and understand their data.